As part of the Digital Ocean Kubernetes Challenge, I deployed the Elasticearch, Fluentd and Kibana stack for log analytics. It's my first time deploying a Statefulset and Daemonset, and I encountered several challenges along the way, which gave me the opportunity to practice debugging Kubernetes issues.
I started off by developing in a local cluster, but in this guide I will demonstrate how to deploy on Digital Ocean's managed Kubernetes cluster.
This is not a production-ready deployment. Rather it is a simplified guide to get started learning how to set up Elasticsearch, fluentd and Kibana.
The completed repo can be found here. Feel free to clone it to follow along.
$ git clone https://github.com/joshchoo/digital-ocean-kubernetes-challenge.gitLet's begin by provisioning three nodes with at least 4GB of RAM. I found that using the nodes with less RAM from Digital Ocean caused the pods to crash continuously 🥲.
Provisioning three nodes allows the Elasticsearch service to tolerate one node becoming unavailable.
$ doctl kubernetes cluster create k8s-challenge \
--size=s-2vcpu-4gb \
--count=3 \
--region=sgp1 \
--surge-upgrade=false \
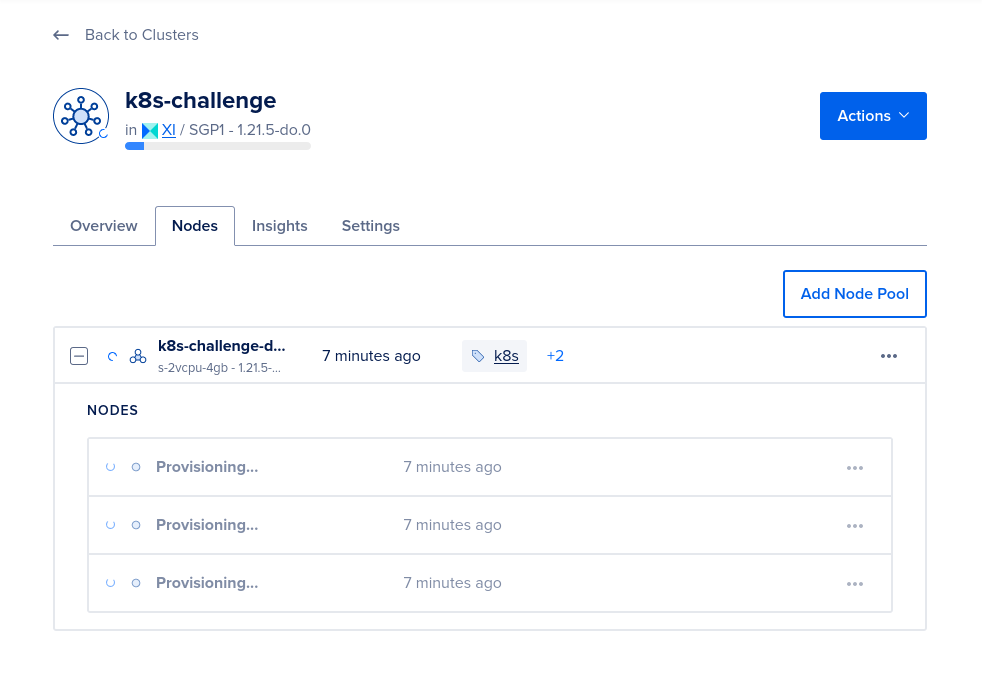
--wait=falseIt takes a while for Digital Ocean to provision the nodes. We can check the progress on the Digital Ocean site:
Once the nodes have been provisioned, we should see the following details:
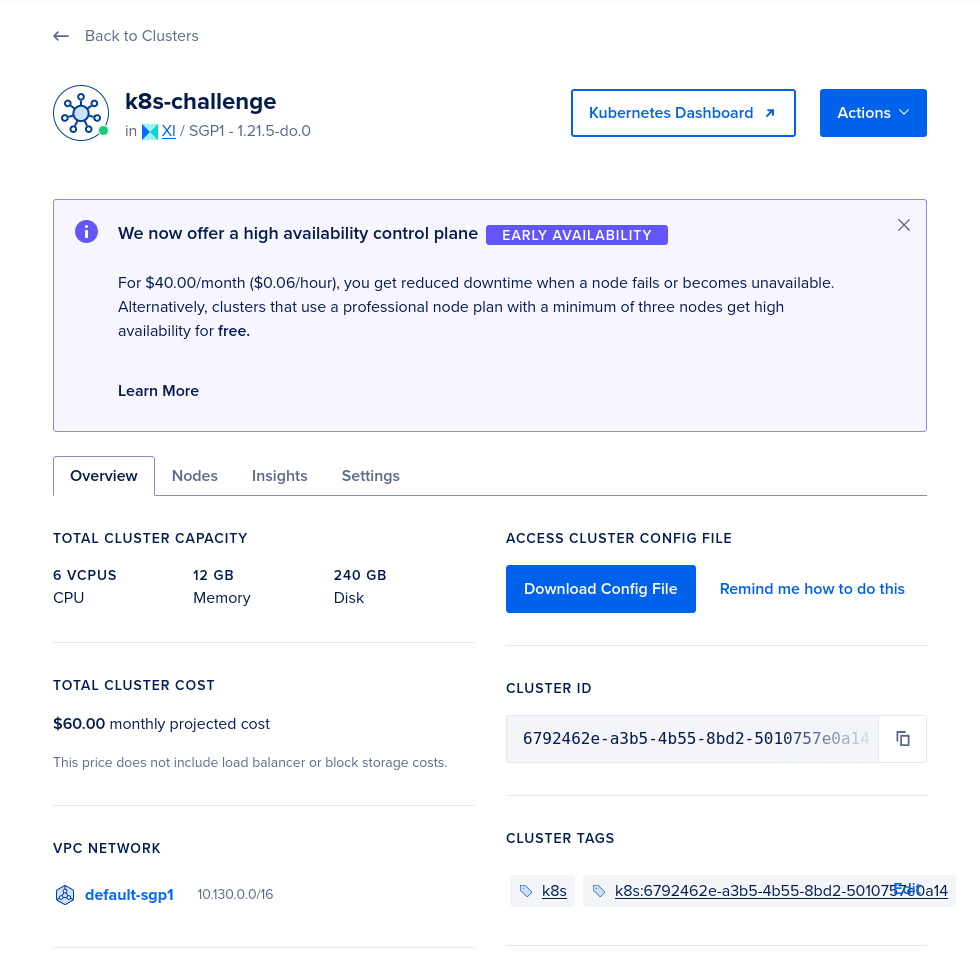
We can click on the "Kubernetes Dashboard" button to open the dashboard!
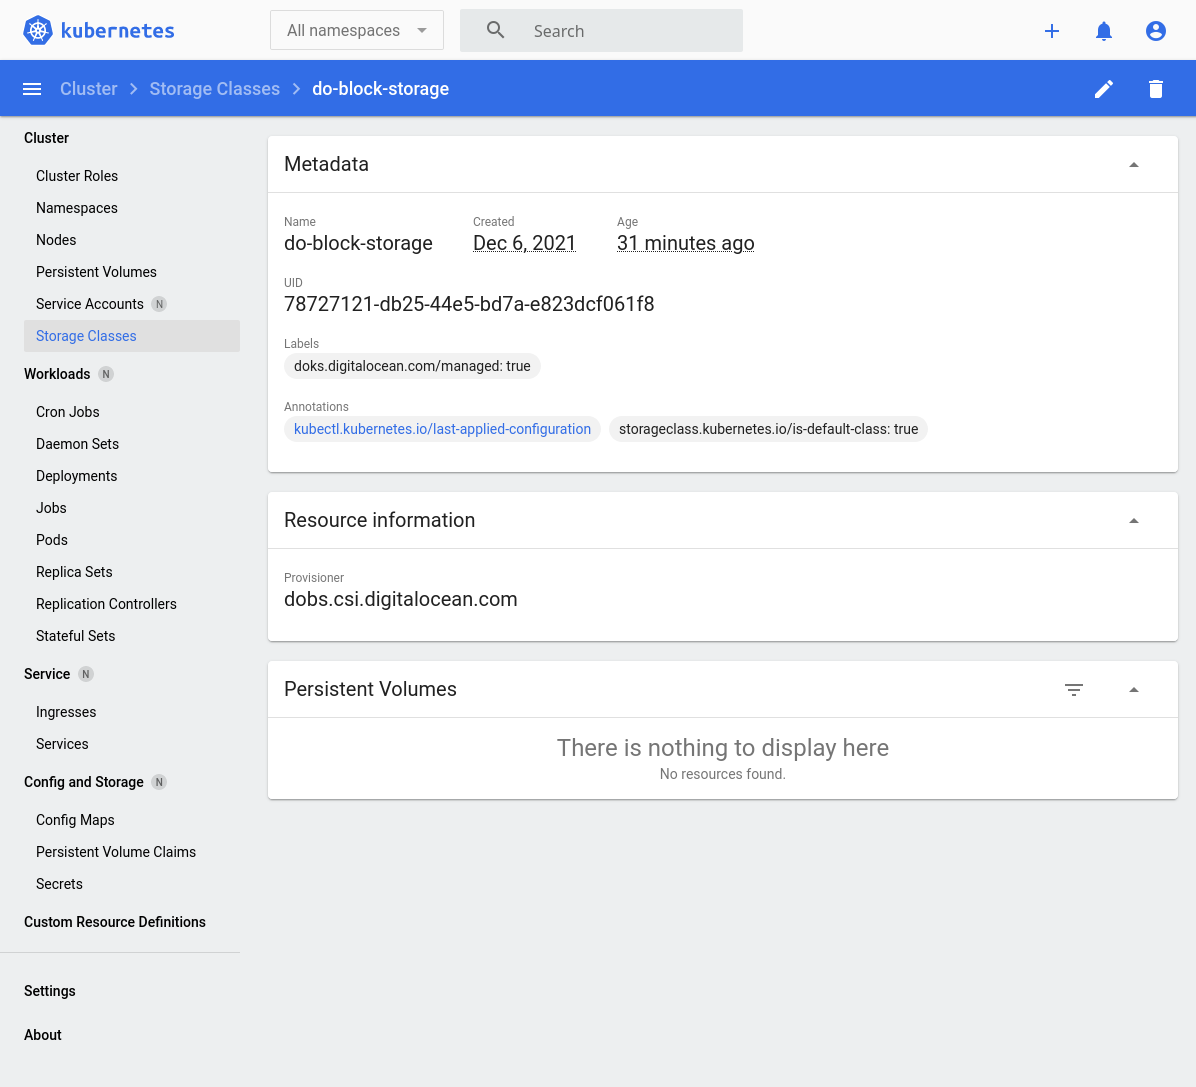
On the dashboard, take note that Digital Ocean has provided the do-block-storage Storage Class. We will use this to conveniently provision Elasticsearch with storage backed by Digital Ocean's Block Storage.
After creating the cluster, the context should have changed to the newly provisioned cluster. This means that future kubectl commands will execute against the Kubernetes cluster on Digital Ocean instead of local clusters, such as that created by minikube.
$ kubectl config get-contexts
CURRENT   NAME                    CLUSTER                 AUTHINFO                      NAMESPACE
*         do-sgp1-k8s-challenge   do-sgp1-k8s-challenge   do-sgp1-k8s-challenge-admin
minikube minikube minikube defaultBy default, Kubernetes deploys resources to the default namespace. A namespace is like a logical sub-cluster within the Kubernetes cluster. We shall deploy our logging analytics stack to a new logging namespace.
# infra/logging-ns.yaml
apiVersion: v1
kind: Namespace
metadata:
  name: logging
$ kubectl apply -f infra/logging-ns.yamlElasticsearch is a search engine that is commonly used to search for logs across many backend applications.
We shall deploy the Elasticsearch cluster in the newly-created logging namespace. The Elasticsearch resource will be a StatefulSet instead of Deployment to maintain persistent identifiers on Elasticsearch pods. Persistent identifiers ensure that the "primary" Elasticsearch pod does not access the storage of the secondary, and vice versa.
As mentioned previously, we created three replicas (each deployed on a different node) so that Elasticsearch can tolerate one node becoming unavailable. If one node fails, the remaining two can still form a quorum and elect a new leader.
As previously mentioned, we will use the do-block-storage Storage Class to automatically provision storage on Digital Ocean.
The tedious alternative would have been to manually provision Digital Ocean Block Storage, and deploy Persistent Volume and Persistent Volume Claim resources. Thankfully we don't have to do this.
# infra/elasticsearch.yaml
apiVersion: apps/v1
kind: StatefulSet
metadata:
name: elasticsearch-cluster
namespace: logging
spec:
selector:
matchLabels:
app: elasticsearch
serviceName: elasticsearch
# Create at least 3 primary-eligible nodes so that if one fails, the others can still safely form a quorum.
# Source: https://www.elastic.co/guide/en/elasticsearch/reference/current/modules-discovery-voting.html
replicas: 3
template:
metadata:
labels:
app: elasticsearch
spec:
containers:
- name: elasticsearch
image: docker.elastic.co/elasticsearch/elasticsearch:7.15.2
resources:
limits:
cpu: 1000m
requests:
cpu: 100m
ports:
- containerPort: 9200
name: http-api
protocol: TCP
- containerPort: 9300
name: inter-node
protocol: TCP
volumeMounts:
- name: elasticsearch-data # should match volumeClaimTemplates.metadata.name
mountPath: /usr/share/elasticsearch/data
# See required envvars: https://www.elastic.co/guide/en/elasticsearch/reference/7.15/docker.html#docker-compose-file
env:
- name: node.name
valueFrom:
fieldRef:
fieldPath: metadata.name # resolves to elasticsearch-{ordinal}
- name: cluster.name
value: elasticsearch-cluster
- name: discovery.seed_hosts
# DNS name for each Pod: <StatefulSet metadata.name-{ordinal}>.<serviceName>.<namespace>.svc.cluster.local
# Truncated DNS: <StatefulSet metadata.name-{ordinal}>.<serviceName>
value: "elasticsearch-cluster-0.elasticsearch,elasticsearch-cluster-1.elasticsearch,elasticsearch-cluster-2.elasticsearch"
# The initial master nodes should be identified by their node.name, which we defined above.
# See: https://www.elastic.co/guide/en/elasticsearch/reference/7.9/discovery-settings.html#CO15-1
- name: cluster.initial_master_nodes
value: "elasticsearch-cluster-0,elasticsearch-cluster-1,elasticsearch-cluster-2"
# Disabled bootstrap.memory_lock because of error: "memory locking requested for elasticsearch process but memory is not locked"
# - name: bootstrap.memory_lock
# value: "true"
- name: ES_JAVA_OPTS
value: "-Xms512m -Xmx512m"
- name: "node.max_local_storage_nodes"
value: "3"
initContainers:
# https://www.digitalocean.com/community/tutorials/how-to-set-up-an-elasticsearch-fluentd-and-kibana-efk-logging-stack-on-kubernetes
- name: fix-permissions
image: busybox
command: ["sh", "-c", "chown -R 1000:1000 /usr/share/elasticsearch/data"]
securityContext:
privileged: true
volumeMounts:
- name: elasticsearch-data
mountPath: /usr/share/elasticsearch/data
# Elasticsearch demands at least vm.max_map_count 262144 compared to the default 65530
# Related: https://stackoverflow.com/questions/51445846/elasticsearch-max-virtual-memory-areas-vm-max-map-count-65530-is-too-low-inc
- name: increase-vm-max-map-count
image: busybox
command: ["sysctl", "-w", "vm.max_map_count=262144"]
securityContext:
privileged: true
volumeClaimTemplates:
- metadata:
name: elasticsearch-data
spec:
storageClassName: do-block-storage
accessModes:
- ReadWriteOnce
resources:
requests:
storage: 1Gi
---
apiVersion: v1
kind: Service
metadata:
name: elasticsearch
namespace: logging
spec:
selector:
app: elasticsearch
# Set up a headless service
clusterIP: None
ports:
# The HTTP API interface for client requests
- name: http-api
port: 9200
targetPort: 9200
# The transport interface for inter-node communication
- name: inter-node
port: 9300
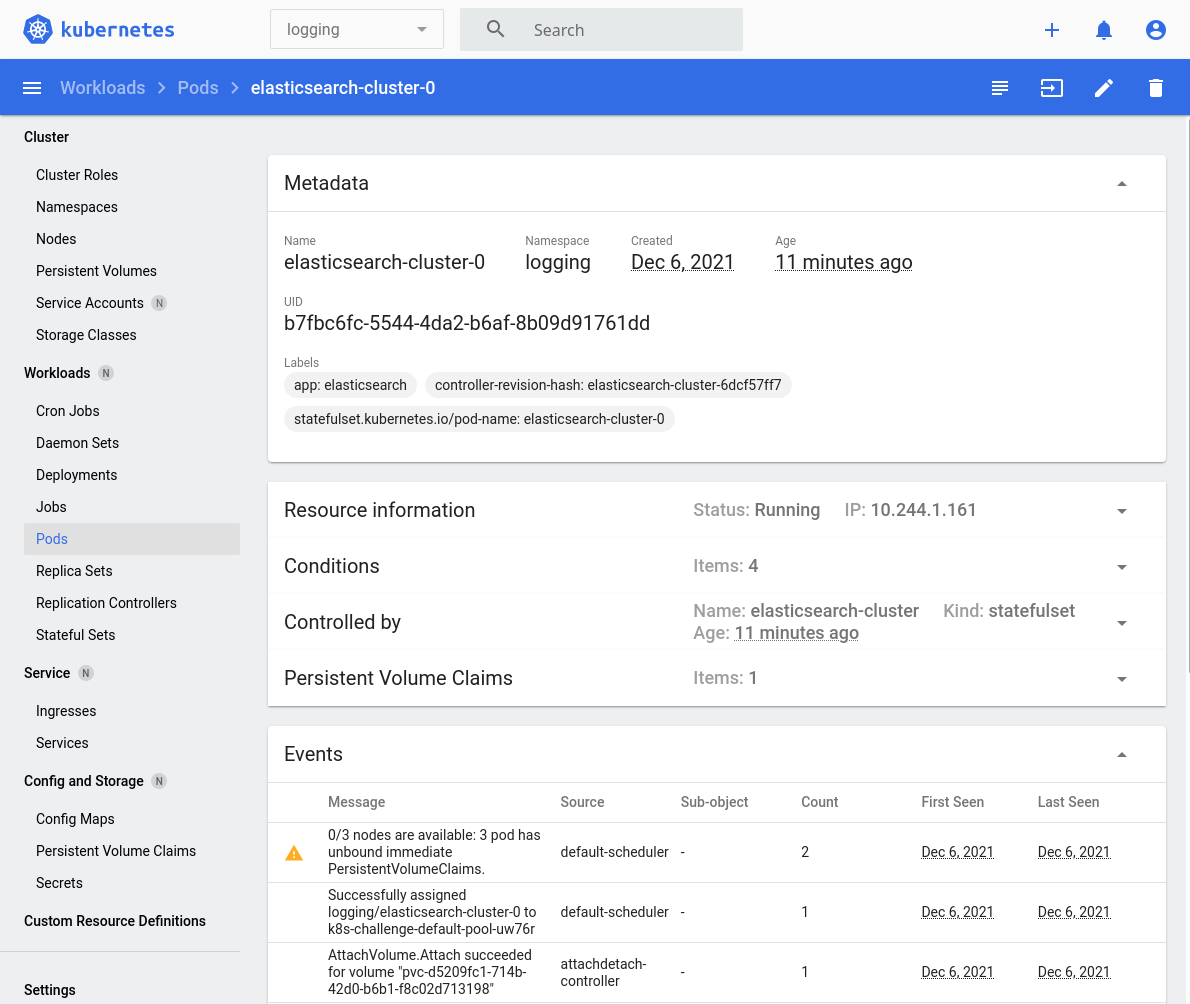
targetPort: 9300$ kubectl apply -f infra/elasticsearch.yamlWe might see some "pod has unbound immediate PersistentVolumeClaims" warnings when viewing logs for the Pods (see image), but that just means that there isn't yet an underlying Persistent Volume to support the PersistentVolumeClaims. Don't worry about it! Digital Ocean is provisioning the Block Storage for the Persistent Volume behind-the-scenes. Just wait a bit and the warning should disappear.
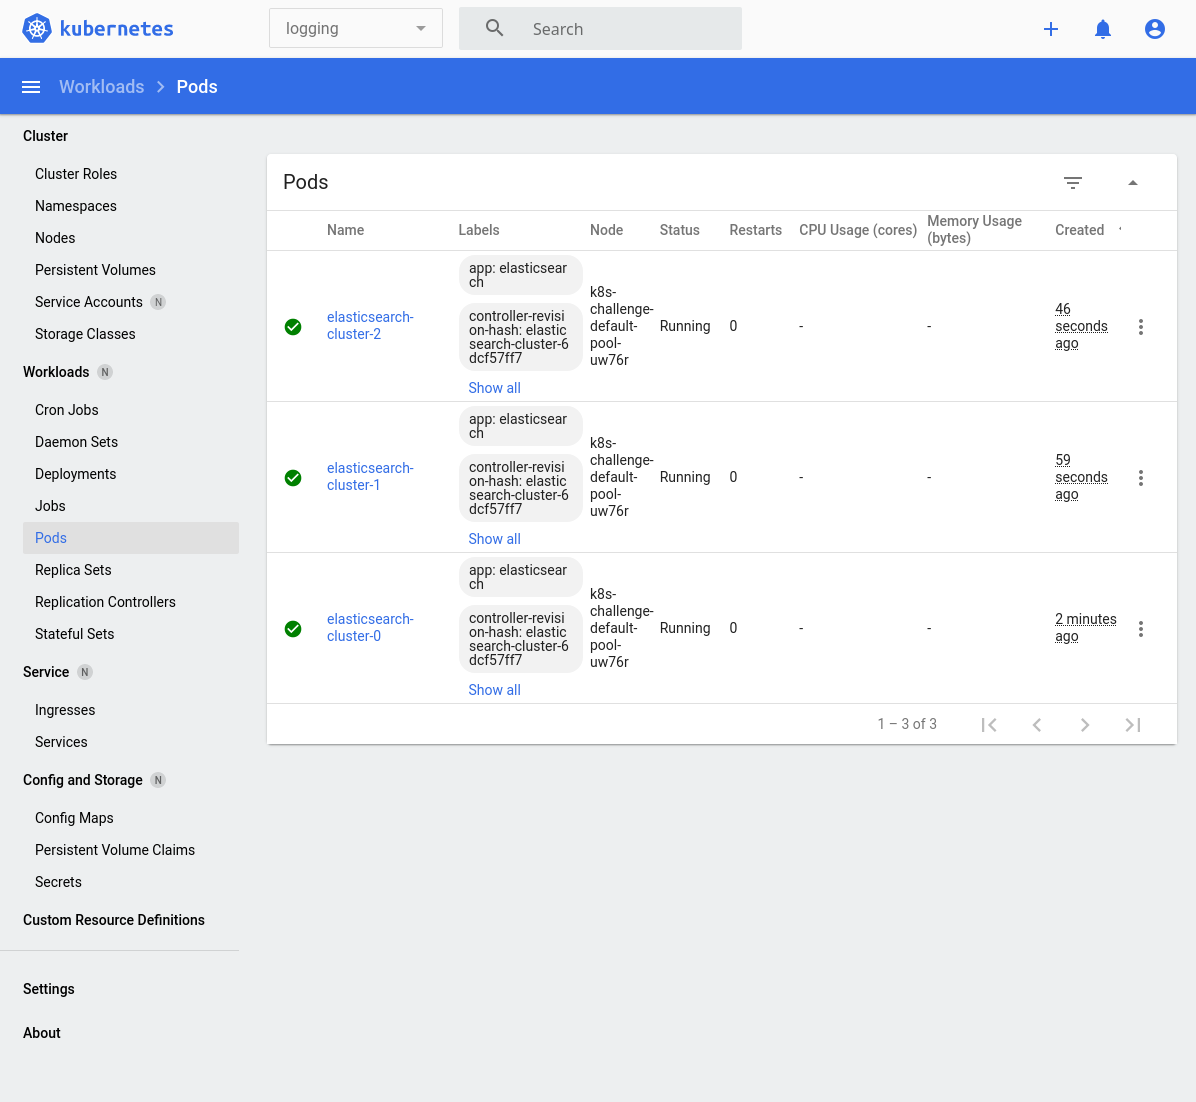
We should see the following when the Elasticsearch pods are now ready. Notice in the top menu-bar that we are narrowing to the logging namespace:
$ kubectl get pods -n logging
NAME                      READY   STATUS    RESTARTS   AGE
elasticsearch-cluster-0   1/1     Running   0          11m
elasticsearch-cluster-1   1/1     Running   0          10m
elasticsearch-cluster-2   1/1     Running   0          10m
We can test that the service is running by sending a request to it. First, we need to establish a port-forward so that we can send requests via localhost (127.0.0.1) to the Elasticsearch port at :9200.
$ kubectl port-forward elasticsearch-cluster-0 9200:9200 -n logging
Forwarding from 127.0.0.1:9200 -> 9200
Forwarding from [::1]:9200 -> 9200
We should see the following response if Elasticsearch is running successfully.
$ curl 127.0.0.1:9200
{
  "name" : "elasticsearch-cluster-0",
  "cluster_name" : "elasticsearch-cluster",
  "cluster_uuid" : "84XJWldhT3qX0WNG8_JqEQ",
  "version" : {
    "number" : "7.15.2",
    "build_flavor" : "default",
    "build_type" : "docker",
    "build_hash" : "93d5a7f6192e8a1a12e154a2b81bf6fa7309da0c",
    "build_date" : "2021-11-04T14:04:42.515624022Z",
    "build_snapshot" : false,
    "lucene_version" : "8.9.0",
    "minimum_wire_compatibility_version" : "6.8.0",
    "minimum_index_compatibility_version" : "6.0.0-beta1"
  },
  "tagline" : "You Know, for Search"
}We've just deployed Elasticsearch, but we need a way to collect logs from other applications running in our Kubernetes cluster. Applications typically write their logs to stdout or stderr, and Kubernetes stores the pod container logs in /var/log.
fluentd is a data collector that allows us to push these logs to Elasticsearch so that we can search the logs there. We shall deploy it as a DaemonSet because we want fluentd to run on every Kubernetes node.
We will also create a ServiceAccount resource and bind it with a ClusterRole that grants fluentd permissions to get/list/watch pods and namespaces.
Important: We need to ensure that fluentd does not read its own logs from /var/log. Otherwise this could cause an error that prevent fluentd from sending logs to Elasticsearch. See the FLUENT_CONTAINER_TAIL_EXCLUDE_PATH environment variable below for the fix.
# infra/fluentd.yaml
apiVersion: apps/v1
kind: DaemonSet
metadata:
  name: fluentd
  namespace: logging
  labels:
    app: fluentd
spec:
  selector:
    matchLabels:
      app: fluentd
  template:
    metadata:
      labels:
        app: fluentd
    spec:
      # Use the fluentd ServiceAccount to run this pod
      serviceAccountName: fluentd
      tolerations:
        - key: node-role.kubernetes.io/master
          effect: NoSchedule
      containers:
        - name: fluentd
          image: fluent/fluentd-kubernetes-daemonset:v1.14.3-debian-elasticsearch7-1.0
          env:
            - name: FLUENT_ELASTICSEARCH_HOST
              value: "elasticsearch.logging.svc.cluster.local"
            - name: FLUENT_ELASTICSEARCH_PORT
              value: "9200"
            - name: FLUENT_ELASTICSEARCH_SCHEME
              value: "http"
            - name: FLUENTD_SYSTEMD_CONF
              value: disable
              # Fixes logs not being sent to Elasticsearch/Kibana: https://github.com/fluent/fluentd/issues/2545#issuecomment-747488212
              # Prevent Fluentd from reading its own logs recursively...
            - name: FLUENT_CONTAINER_TAIL_EXCLUDE_PATH
              value: /var/log/containers/fluent*
            - name: FLUENT_CONTAINER_TAIL_PARSER_TYPE
              value: /^(?<time>.+) (?<stream>stdout|stderr) [^ ]* (?<log>.*)$/
          resources:
            limits:
              memory: 512Mi
            requests:
              cpu: 100m
              memory: 200Mi
          # Map the Node's folders onto the Pod's
          volumeMounts:
            - name: varlog
              # Kubernetes captures stdout/stderr logs from each pod to the Node's /var/log path.
              mountPath: /var/log
            - name: varlibdockercontainers
              mountPath: /var/lib/docker/containers
              readOnly: true
      terminationGracePeriodSeconds: 30
      volumes:
        - name: varlog
          hostPath:
            path: /var/log
        - name: varlibdockercontainers
          hostPath:
            path: /var/lib/docker/containers
---
apiVersion: v1
kind: ServiceAccount
metadata:
  name: fluentd
  namespace: logging
  labels:
    app: fluentd
---
apiVersion: rbac.authorization.k8s.io/v1
kind: ClusterRole
metadata:
  name: fluentd
  labels:
    app: fluentd
rules:
  - apiGroups:
      - ""
    resources:
      - pods
      - namespaces
    verbs:
      - get
      - list
      - watch
---
# Bind the above ClusterRole permissions to the ServiceAccount
kind: ClusterRoleBinding
apiVersion: rbac.authorization.k8s.io/v1
metadata:
  name: fluentd
roleRef:
  kind: ClusterRole
  name: fluentd
  apiGroup: rbac.authorization.k8s.io
subjects:
  - kind: ServiceAccount
    name: fluentd
    namespace: logging
Let's deploy the fluentd resources.
$ kubectl apply -f infra/fluentd.yamlWe should see three fluentd pods, one for each node.
$ kubectl get pods -n logging
NAME                          READY   STATUS    RESTARTS   AGE
pod/elasticsearch-cluster-0   1/1     Running   0          19m
pod/elasticsearch-cluster-1   1/1     Running   0          18m
pod/elasticsearch-cluster-2   1/1     Running   0          18m
pod/fluentd-5c79q             1/1     Running   0          3m13s
pod/fluentd-j8szn             1/1     Running   0          3m13s
pod/fluentd-wrkkd 1/1 Running 0 3m13sWe've deployed Elasticsearch and fluentd, which means that we can now capture logs from pods running in our Kubernetes cluster and search them by querying Elasticsearch's REST API.
Searching the logs via the REST API is not a great user experience though. Instead we could use Kibana, which provides a web page to search for logs in a web browser!
Because Kibana is a stateless application, we will deploy it as a Deployment resource instead of StatefulSet. Additionally, we will set the Kibana server base path to the /kibana endpoint.
# infra/kibana.yaml
apiVersion: v1
kind: Service
metadata:
  name: kibana
  namespace: logging
  labels:
    app: kibana
spec:
  ports:
    - port: 5601
  selector:
    app: kibana
---
apiVersion: apps/v1
kind: Deployment
metadata:
  name: kibana
  namespace: logging
  labels:
    app: kibana
spec:
  replicas: 1
  selector:
    matchLabels:
      app: kibana
  template:
    metadata:
      labels:
        app: kibana
    spec:
      containers:
        - name: kibana
          image: docker.elastic.co/kibana/kibana:7.15.2
          resources:
            limits:
              cpu: 1000m
            requests:
              cpu: 100m
          env:
            # This should match the path specified in the Ingress file
            - name: SERVER_BASEPATH
              value: "/kibana"
            - name: SERVER_REWRITEBASEPATH
              value: "true"
            - name: ELASTICSEARCH_HOSTS
              value: http://elasticsearch:9200
            - name: ELASTICSEARCH_URL
              value: http://elasticsearch:9200
          ports:
            - containerPort: 5601
$ kubectl apply -f infra/kibana.yamlWe should see one Kibana pod running.
$ kubectl get pods -n logging
NAME                      READY   STATUS    RESTARTS   AGE
elasticsearch-cluster-0   1/1     Running   0          24m
elasticsearch-cluster-1   1/1     Running   0          23m
elasticsearch-cluster-2   1/1     Running   0          23m
fluentd-5c79q             1/1     Running   0          8m19s
fluentd-j8szn             1/1     Running   0          8m19s
fluentd-wrkkd             1/1     Running   0          8m19s
kibana-64dd44844b-cnls2   1/1     Running   0          4m24s
Let's set up a port-forward to the Kibana pod so that we can access it from our web browser locally.
$ kubectl port-forward kibana-64dd44844b-cnls2 5601:5601 -n logging
Forwarding from 127.0.0.1:5601 -> 5601
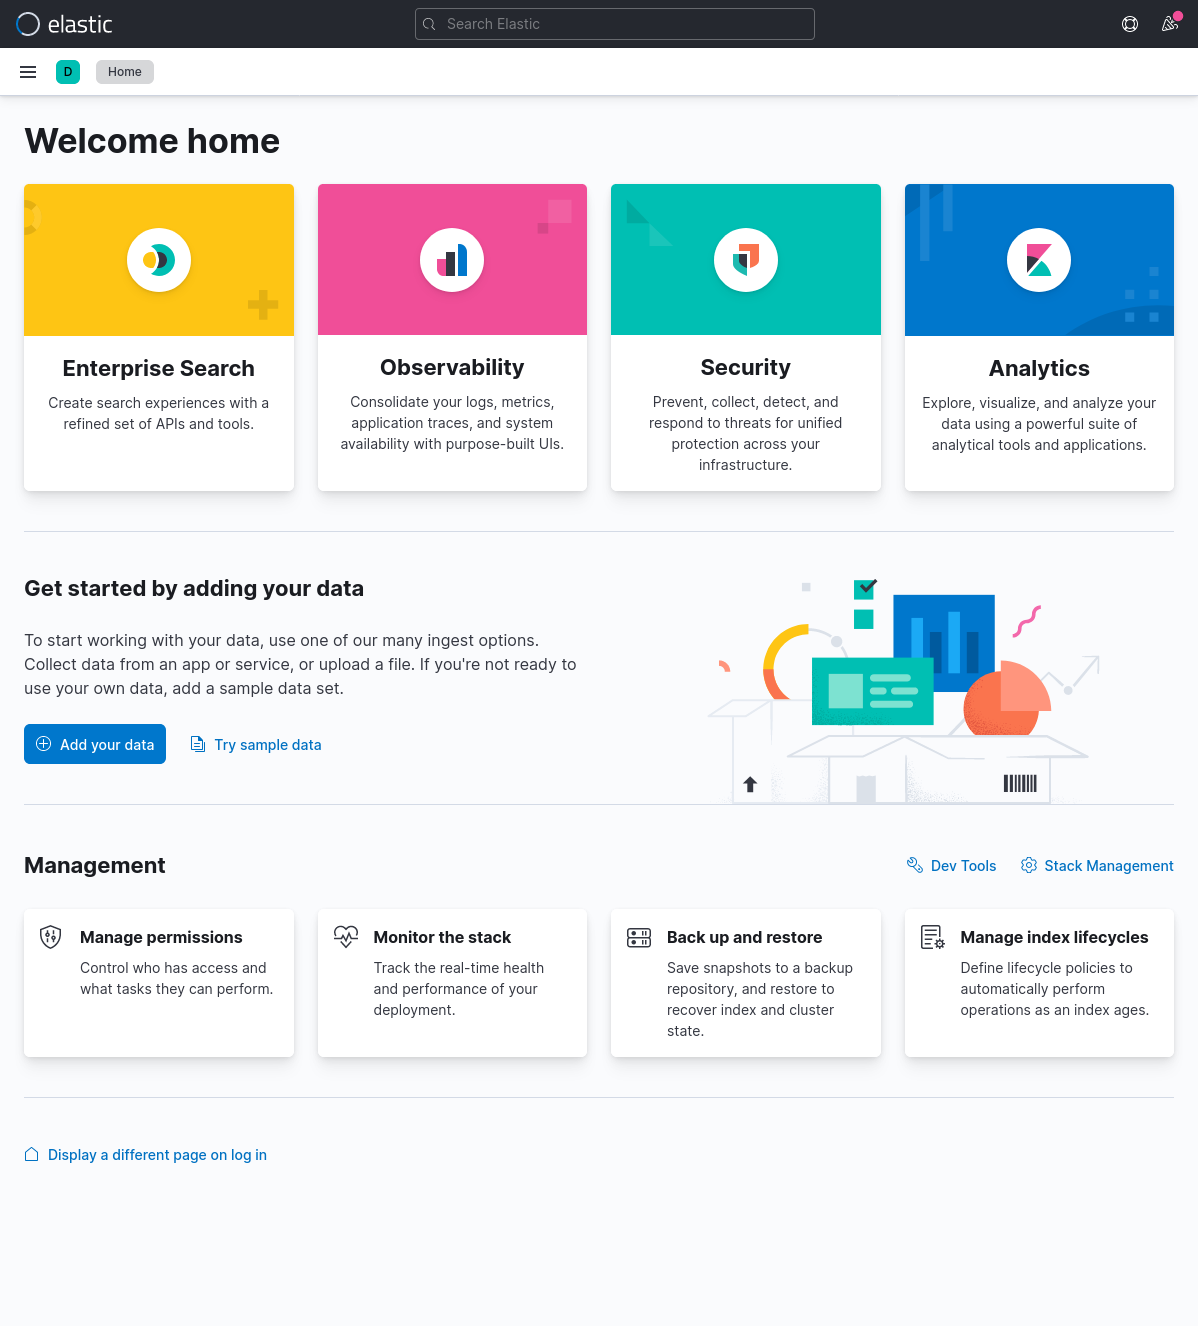
Forwarding from [::1]:5601 -> 5601In a browser, visit http://localhost:5601/kibana. We should be greeted with the Kibana home web page.
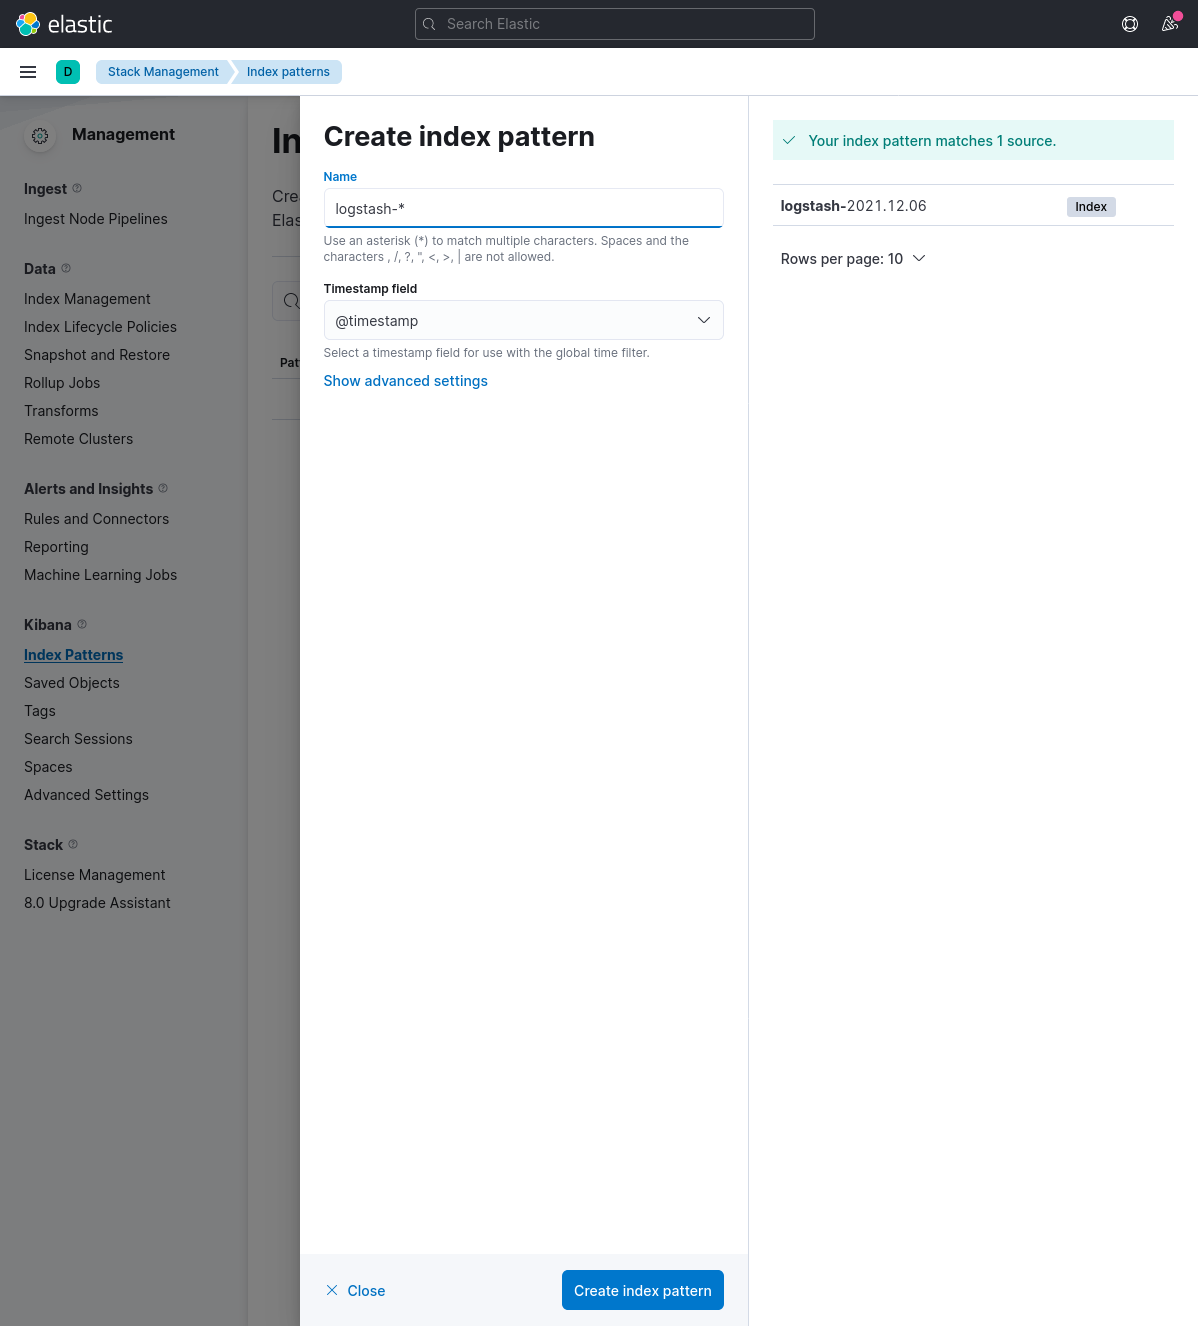
Before we can start seeing logs, we need to create an "index pattern". Open the sidebar -> Analytics -> Discover -> "Create index pattern".
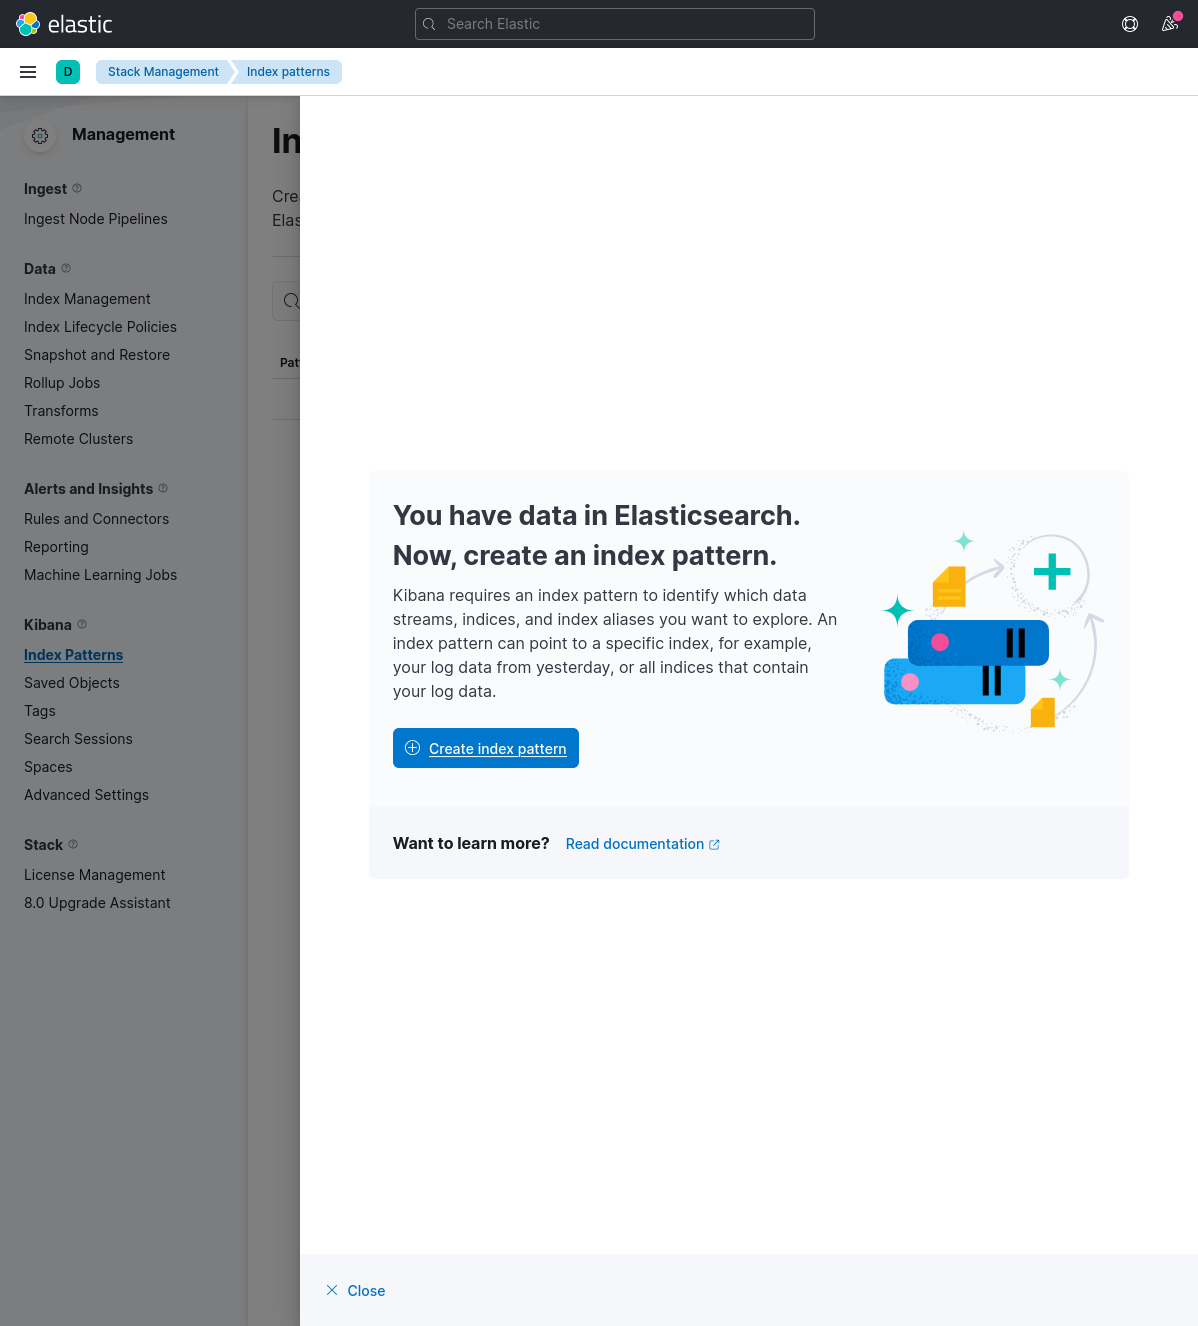
Now enter logstash-* in the "Name" field and @timestamp in the "Timestamp" field, and click on "Create index pattern" to continue.
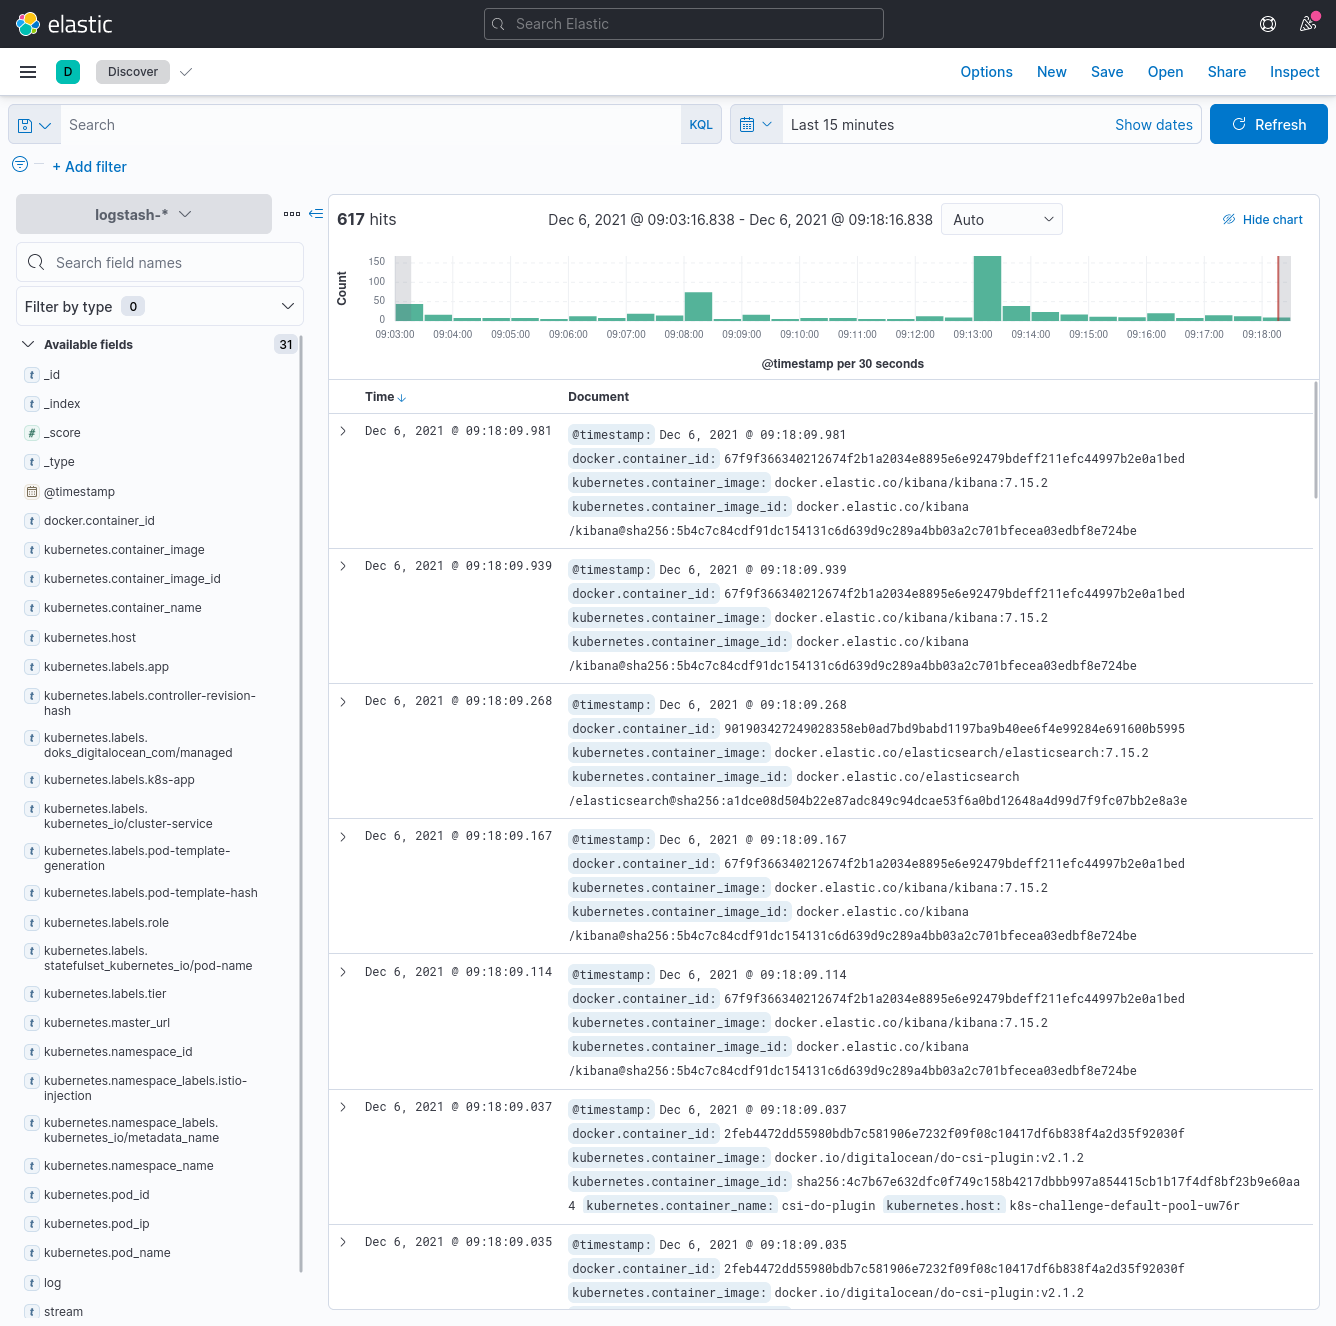
Head back to Discover in the sidebar, and we should see all the logs now! Sweet!
Let's check that logging works properly by deploying an application in a different namespace than logging. Our application is a counter that logs the date and time every second to stdout.
# infra/counter.yaml
apiVersion: v1
kind: Pod
metadata:
  name: counter
spec:
  containers:
    - name: count
      image: busybox
      args: [/bin/sh, -c, 'i=0; while true; do echo "$i: $(date)"; i=$((i+1)); sleep 1; done']
We can inspect the logs from the counter pod with the following kubectl command:
$ kubectl logs counter
0: Mon Dec 6 01:20:21 UTC 2021
1: Mon Dec 6 01:20:22 UTC 2021
2: Mon Dec 6 01:20:23 UTC 2021
3: Mon Dec 6 01:20:24 UTC 2021
4: Mon Dec 6 01:20:25 UTC 2021
5: Mon Dec 6 01:20:26 UTC 2021
6: Mon Dec 6 01:20:27 UTC 2021
7: Mon Dec 6 01:20:28 UTC 2021
8: Mon Dec 6 01:20:29 UTC 2021
9: Mon Dec 6 01:20:30 UTC 2021
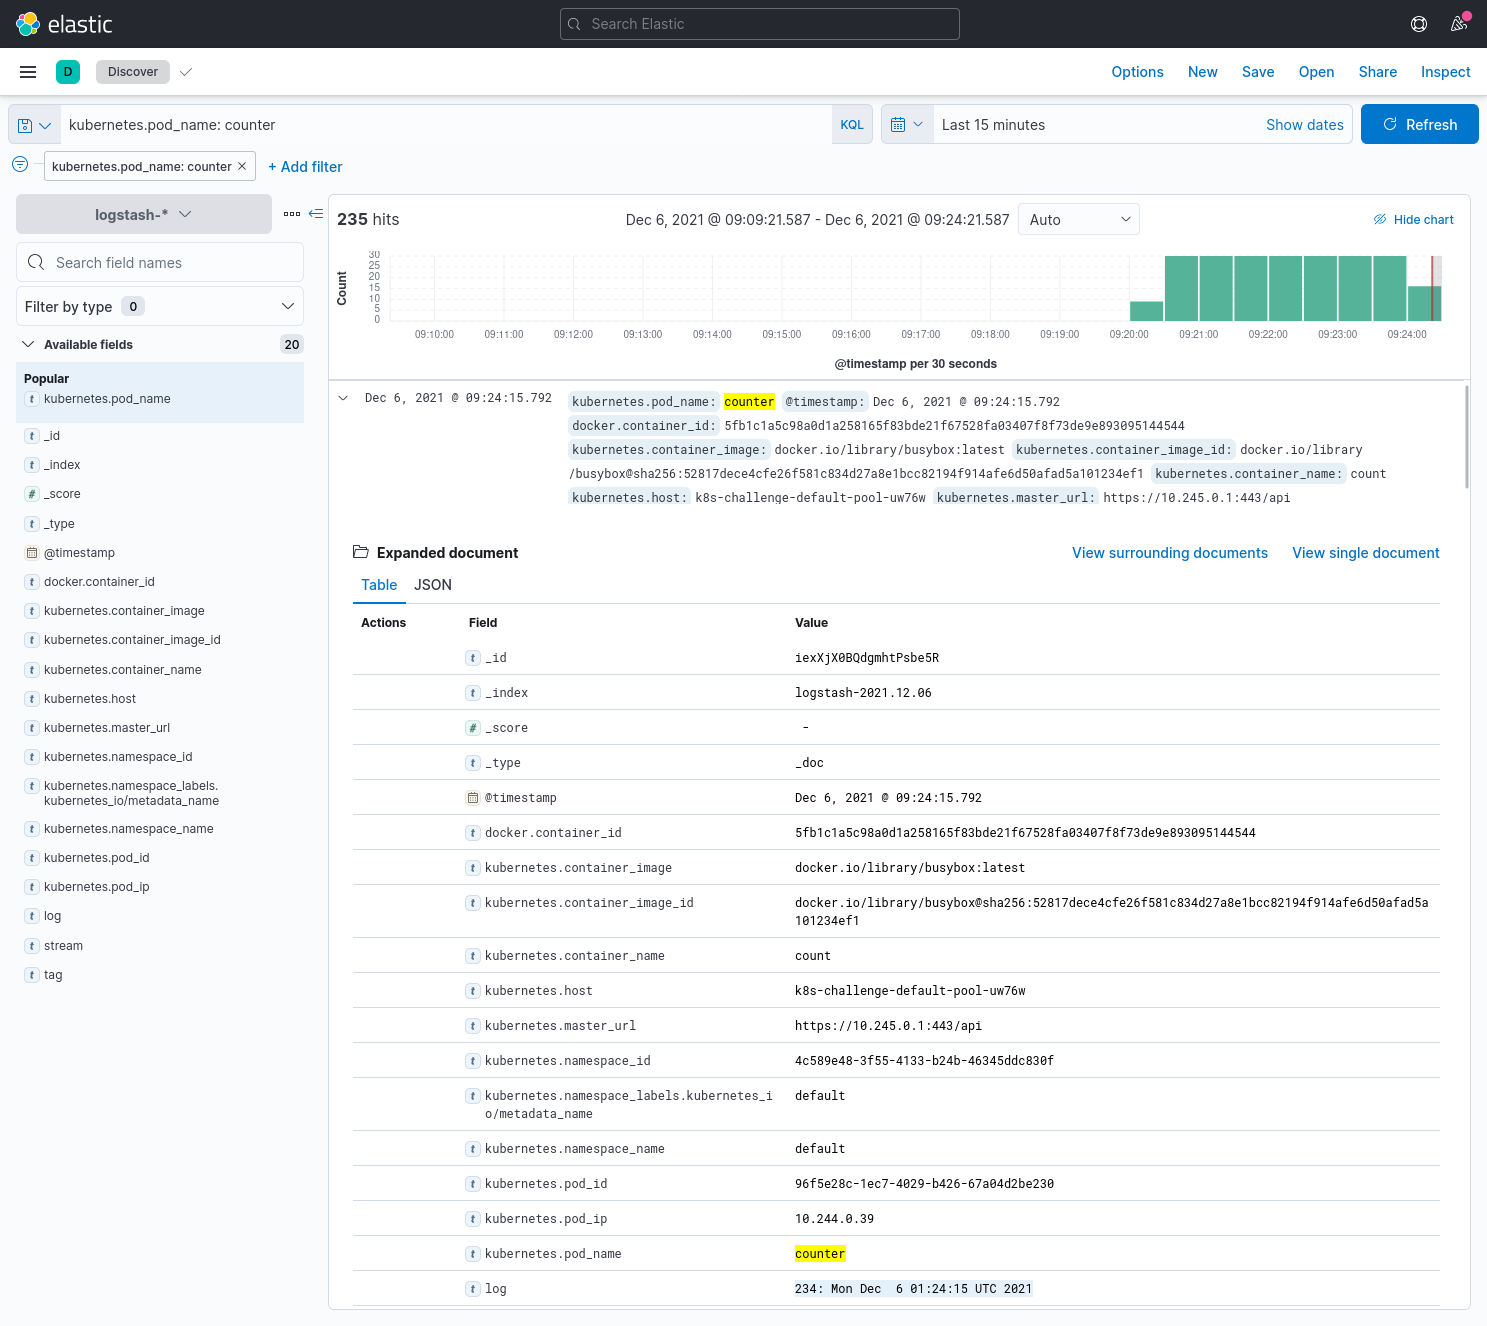
10: Mon Dec 6 01:20:31 UTC 2021Now, let's search Kibana for kubernetes.pod_name: counter, and we should now see the same counter pod's logs!